Lab 04: Windows Security Telemetry Engineering
Introduction
Lab 03 relied on a single Windows telemetry source: the Security event log, specifically Event ID 4625 for failed logon attempts. That was sufficient to detect brute force and credential stuffing activity, but it represents only one slice of what a Windows endpoint can tell an analyst. A host under investigation produces telemetry across several overlapping but distinct sources — authentication events, system-level state changes, command execution content, and process-level behaviour — and each source has a different blind spot.
This lab moves beyond the Security log to establish the rest of that telemetry landscape: the System log, PowerShell logging (Module Logging and Script Block Logging), and Sysmon. Rather than treating this as a checklist of "turn on more logging," the goal was to generate a single controlled action and trace how — or whether — it appeared across all four sources, to build an evidence-based picture of what each source is actually for.
The objective of this lab was to:
- Audit the current Windows agent telemetry baseline following an environment rebuild
- Enable PowerShell Module Logging and Script Block Logging
- Deploy Sysmon with a baseline configuration
- Forward all new telemetry sources to Wazuh
- Execute a single controlled trigger — an encoded PowerShell command — and compare how Security, System, PowerShell, and Sysmon each recorded it
- Identify where Wazuh's default alert visibility diverges from the underlying telemetry actually being collected
Lab Environment
Since Lab 03, the original i3 laptop housing the Linux and Windows agents was lost, and the environment has been consolidated onto a single i3-6006U host. This host was upgraded with a 512GB SSD to address the HDD-related I/O bottleneck noted in Lab 03. The Wazuh server itself also runs on this same host, alongside the rebuilt Linux agent VM — meaning the entire platform, not just the endpoints, is now consolidated onto one machine. The existing Windows machine was re-enrolled as the Windows agent.
A notable constraint surfaced during this lab: the Windows host runs Windows 10 Home Edition, which does not include the Local Group Policy Editor (gpedit.msc). Both PowerShell logging policies in this lab were therefore configured directly via the registry keys that Group Policy would otherwise manage — functionally identical in outcome, but worth noting as an environment-specific adaptation.
Part 1 — Baseline Audit
Before making any changes, the Windows agent's ossec.conf was reviewed to establish what was already being collected, given the time elapsed since earlier labs and the hardware rebuild.
The following <localfile> blocks were already present:
<localfile>
  <location>Application</location>
  <log_format>eventchannel</log_format>
</localfile>
<localfile>
  <location>Security</location>
  <log_format>eventchannel</log_format>
  <query>Event/System[EventID != 5145 and EventID != 5156 and EventID != 5447 and
    EventID != 4656 and EventID != 4658 and EventID != 4663 and EventID != 4660 and
    EventID != 4670 and EventID != 4690 and EventID != 4703 and EventID != 4907 and
    EventID != 5152 and EventID != 5157]</query>
</localfile>
<localfile>
  <location>System</location>
  <log_format>eventchannel</log_format>
</localfile>
<localfile>
  <location>active-response\active-responses.log</location>
  <log_format>syslog</log_format>
</localfile>
Security, System, and Application were already configured — Security carried over from Lab 03, while System and Application appear to be included in Wazuh's default Windows agent template. Neither PowerShell logging nor Sysmon had any presence in the configuration. This narrowed the actual scope of the lab to two genuinely new sources rather than the four originally assumed.
The Linux agent's configuration was also reviewed and found to contain only default command-based monitoring (df -P, netstat, last -n 20) — unrelated to this lab's Windows-focused scope, and left unchanged.
A useful discovery during this audit: the location field in Wazuh alerts does not identify which Windows event channel an event came from — it generically reads EventChannel for all of them. The actual channel lives under data.win.system.channel, and this field was used for all source-specific filtering for the remainder of the lab.
Part 2 — Enabling PowerShell Logging
Module Logging
Configured directly via registry, since Windows 10 Home does not support Group Policy:
New-Item -Path "HKLM:\SOFTWARE\Policies\Microsoft\Windows\PowerShell\ModuleLogging" -Force
Set-ItemProperty -Path "HKLM:\SOFTWARE\Policies\Microsoft\Windows\PowerShell\ModuleLogging" -Name "EnableModuleLogging" -Value 1

New-Item -Path "HKLM:\SOFTWARE\Policies\Microsoft\Windows\PowerShell\ModuleLogging\ModuleNames" -Force
Set-ItemProperty -Path "HKLM:\SOFTWARE\Policies\Microsoft\Windows\PowerShell\ModuleLogging\ModuleNames" -Name "*" -Value "*"
The wildcard module name logs all modules rather than a restricted list — the appropriate default for a detection-engineering lab, since limiting logging to known modules would blind the environment to unknown or unexpected ones.
Verified locally by running a simple command and confirming an Event ID 4103 entry appeared under Applications and Services Logs → Microsoft → Windows → PowerShell → Operational.
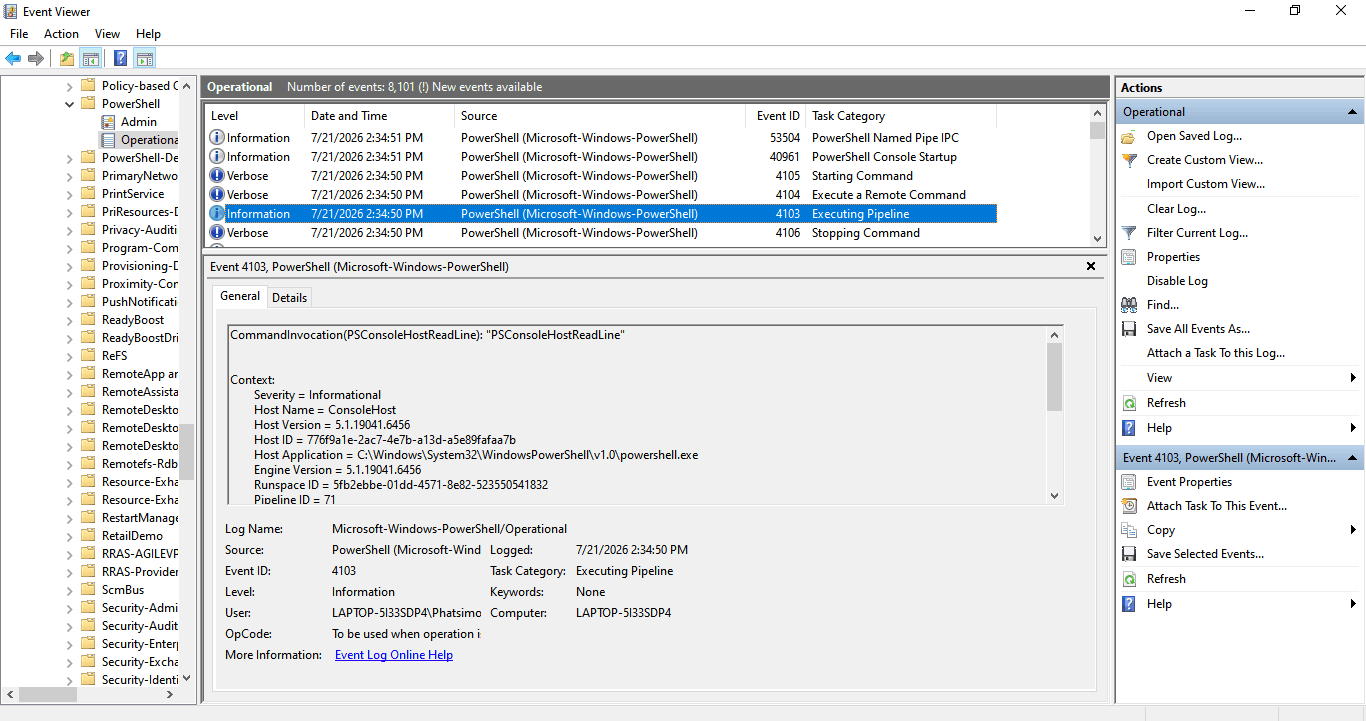 PowerShell Module Logging verification — Event ID 4103
Script Block Logging
New-Item -Path "HKLM:\SOFTWARE\Policies\Microsoft\Windows\PowerShell\ScriptBlockLogging" -Force
Set-ItemProperty -Path "HKLM:\SOFTWARE\Policies\Microsoft\Windows\PowerShell\ScriptBlockLogging" -Name "EnableScriptBlockLogging" -Value 1
Set-ItemProperty -Path "HKLM:\SOFTWARE\Policies\Microsoft\Windows\PowerShell\ScriptBlockLogging" -Name "EnableScriptBlockInvocationLogging" -Value 1
This is the setting that captures the actual textual content of scripts and commands as they execute, including automatic decoding of base64-encoded commands — the capability this lab's controlled trigger depends on.
Verified with a test string, confirming Event ID 4104 appeared with the literal command text visible in the message body.
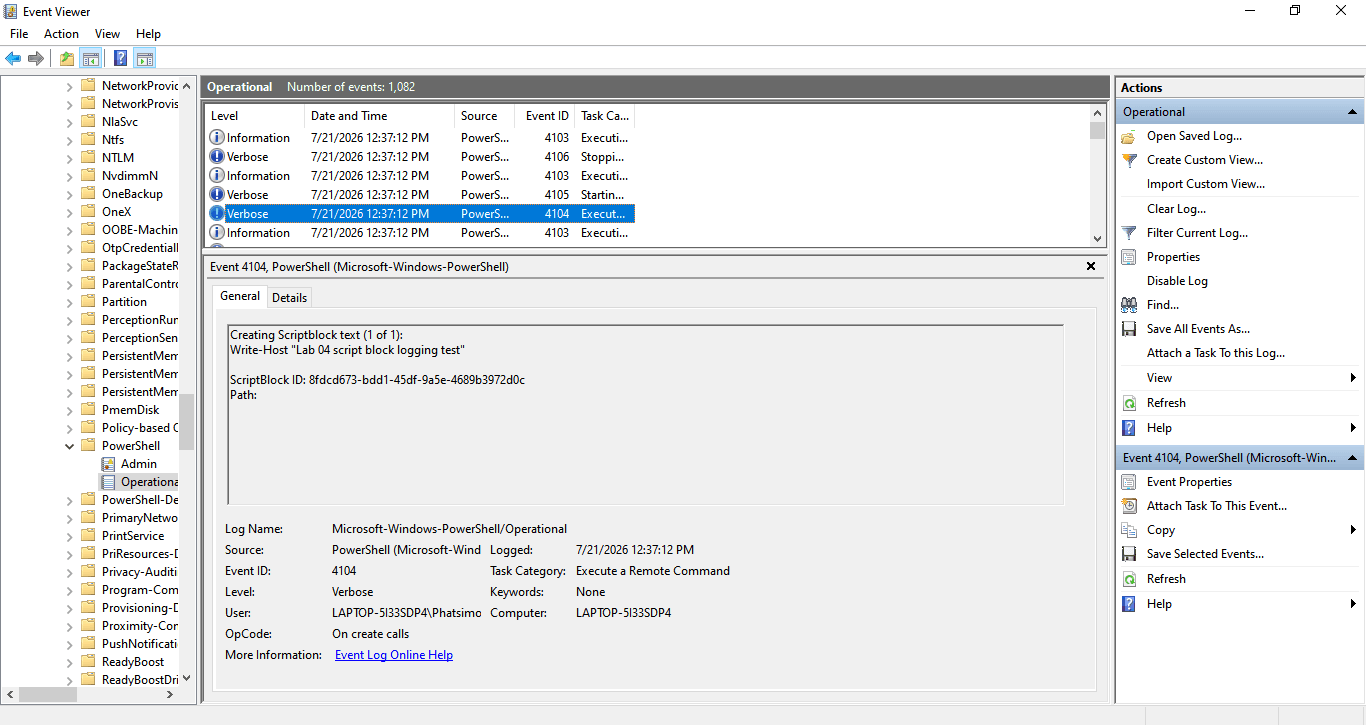 PowerShell Script Block Logging test showing decoded command text
Part 3 — Forwarding PowerShell Telemetry to Wazuh
A new <localfile> block was added to ossec.conf:
<localfile>
  <location>Microsoft-Windows-PowerShell/Operational</location>
  <log_format>eventchannel</log_format>
</localfile>
The Wazuh agent service was restarted to apply the change.
Filtering the dashboard to data.win.system.channel: "Microsoft-Windows-PowerShell/Operational" confirmed the channel was live and forwarding.
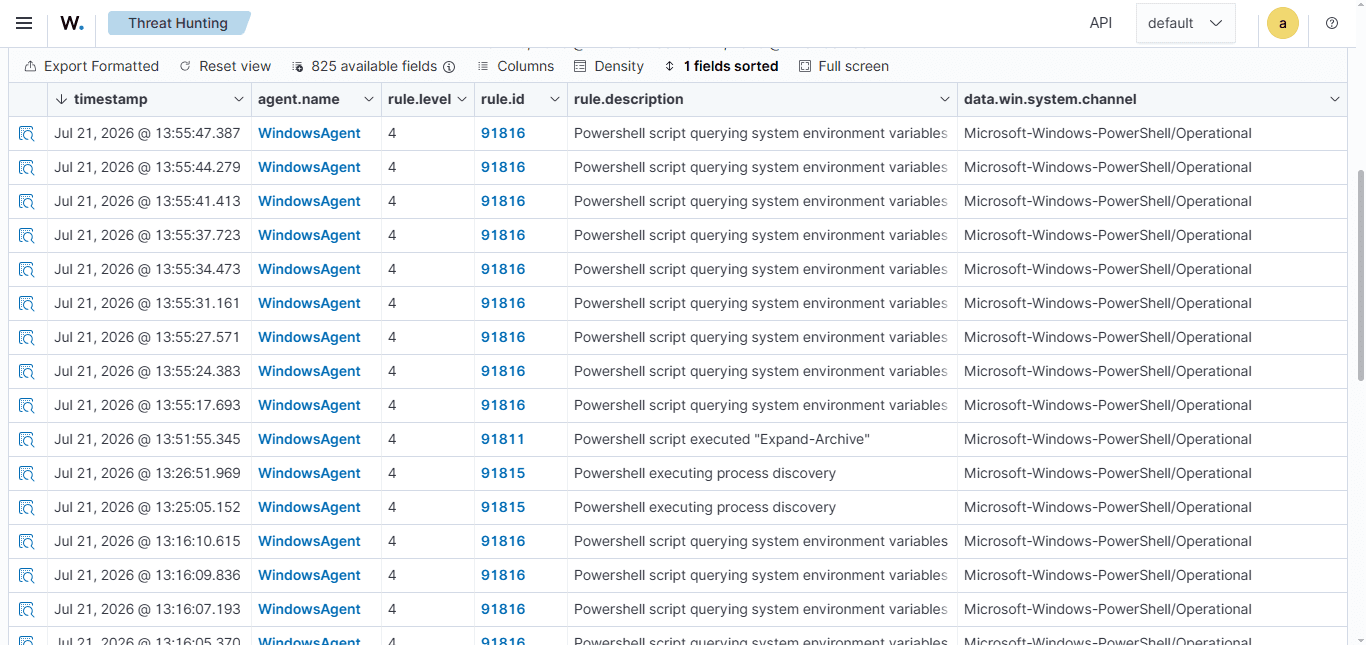 PowerShell Operational events reaching the Wazuh dashboard
An unexpected finding: alert visibility is not the same as telemetry presence
Initial validation ran a Get-Process command, which appeared in the Wazuh dashboard as expected. A follow-up test running Write-Host "Lab 04 script block logging test" generated a confirmed Event ID 4104 entry locally in Event Viewer, but did not appear as an alert in the Wazuh dashboard, despite the channel being confirmed live and forwarding correctly.
The explanation: Wazuh's dashboard surfaces only events that match a rule in the ruleset at a sufficient severity level. Get-Process happened to match an existing PowerShell-related rule; the low-severity, verbose script block event generated by Write-Host did not match any rule and was omitted from the alerts view, even though the underlying telemetry had been received by the manager.
This is a significant finding in its own right: the presence of telemetry and its visibility to an analyst are two different things. A verbose, benign-looking script block event is exactly the kind of activity a low-and-slow attacker might rely on to avoid appearing in a default alerts view — a gap that default rule tuning and custom detection logic (the subject of later labs in this series) exist to close.
Part 4 — Sysmon Deployment
Configuration
A baseline configuration was used rather than running Sysmon unconfigured, which would produce excessive and undocumented noise. SwiftOnSecurity's configuration was selected over more comprehensive alternatives (such as Olaf Hartong's) given the constrained hardware profile of the lab host.
New-Item -Path "C:\Sysmon" -ItemType Directory
Invoke-WebRequest -Uri "https://raw.githubusercontent.com/SwiftOnSecurity/sysmon-config/master/sysmonconfig-export.xml" -OutFile "C:\Sysmon\sysmonconfig.xml"
Installation
Invoke-WebRequest -Uri "https://download.sysinternals.com/files/Sysmon.zip" -OutFile "C:\Sysmon\Sysmon.zip"
Expand-Archive -Path "C:\Sysmon\Sysmon.zip" -DestinationPath "C:\Sysmon"
cd C:\Sysmon
.\Sysmon64.exe -accepteula -i sysmonconfig.xml
Confirmed running via Get-Service -Name Sysmon64.
Forwarding to Wazuh
<localfile>
  <location>Microsoft-Windows-Sysmon/Operational</location>
  <log_format>eventchannel</log_format>
</localfile>
Following an agent restart, ordinary process activity on the host was sufficient to confirm Sysmon Event entries reaching both Event Viewer and the Wazuh dashboard, without the alert-visibility gap seen with PowerShell logging — Sysmon's default ruleset proved considerably more willing to surface events as alerts, a distinction that became directly relevant in Part 5.
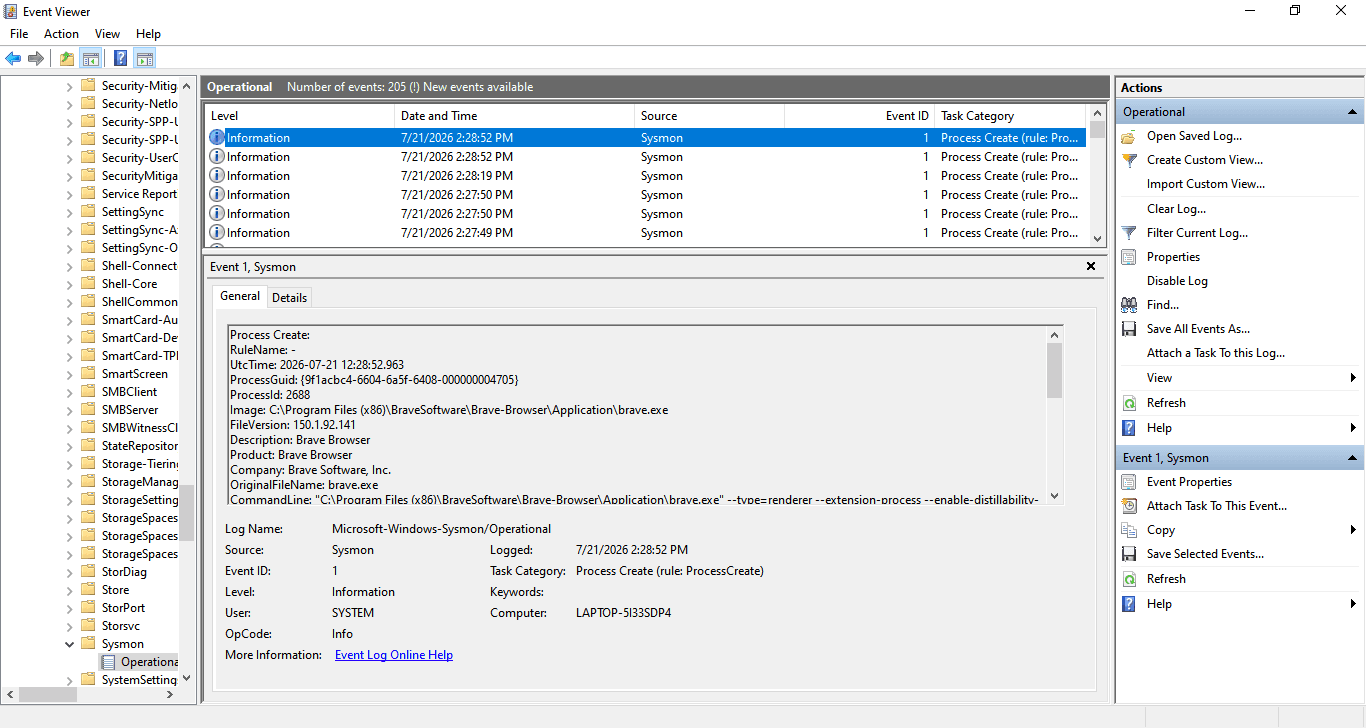 Sysmon events listed in Event Viewer
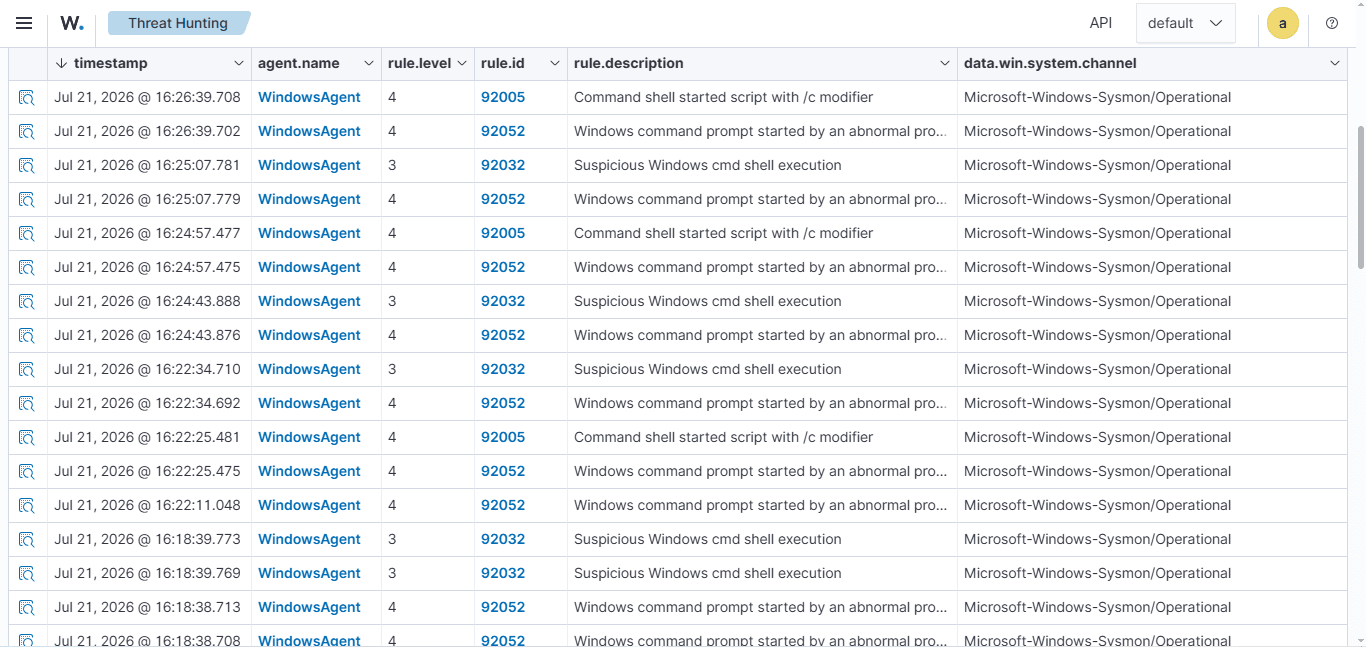 Sysmon events confirmed in the Wazuh dashboard, filtered to the Sysmon Operational channel
Part 5 — Controlled Trigger and Cross-Source Comparison
To compare the four telemetry sources against a single point of ground truth, one deliberate action was executed and then traced across Security, System, PowerShell Operational, and Sysmon.
The Trigger
A base64-encoded PowerShell command — a classic living-off-the-land execution pattern — was chosen because it produces meaningfully different visibility depending on which telemetry source is examined.
$command = 'Get-LocalUser | Select-Object Name'
$bytes = [System.Text.Encoding]::Unicode.GetBytes($command)
$encoded = [Convert]::ToBase64String($bytes)
$encoded
This produced the encoded string that was then executed as the actual trigger:
powershell.exe -EncodedCommand RwBlAHQALQBMAG8AYwBhAGwAVQBzAGUAcgAgAHwAIABTAGUAbABlAGMAdAAtAE8AYgBqAGUAYwB0ACAATgBhAG0AZQA=
The command executed successfully and returned the expected local usernames, confirming this is a functional technique rather than a purely theoretical one. The trigger ran at 15:35:04–15:35:05 CAT, which was used as the reference point across all four sources.
Source-by-Source Results
Security log — No rule-matched event was found in the Wazuh dashboard for this action. A local, non-network process spawn of this kind does not fall within the scope of what the Security log's default auditing policy captures in this environment.
System log — Silent, as expected. Process execution is outside this log's scope; it is oriented toward service and driver state changes.
PowerShell Operational — No alert appeared in the Wazuh dashboard for this specific event, consistent with the alert-visibility gap identified in Part 3. Locally in Event Viewer, however, the picture was more complete than a single event: with Script Block Invocation Logging enabled, PowerShell generated two separate Event ID 4104 entries for this one trigger — one capturing the command line as literally invoked, including the base64 string, and a second capturing the fully decoded script content, Get-LocalUser | Select-Object Name. So the encoded string itself was present in Event Viewer; the meaningful gap wasn't that PowerShell logging failed to show the raw command, but that it also captured the decoded intent behind it — content that neither Security, System, nor Sysmon exposed anywhere in their own data.
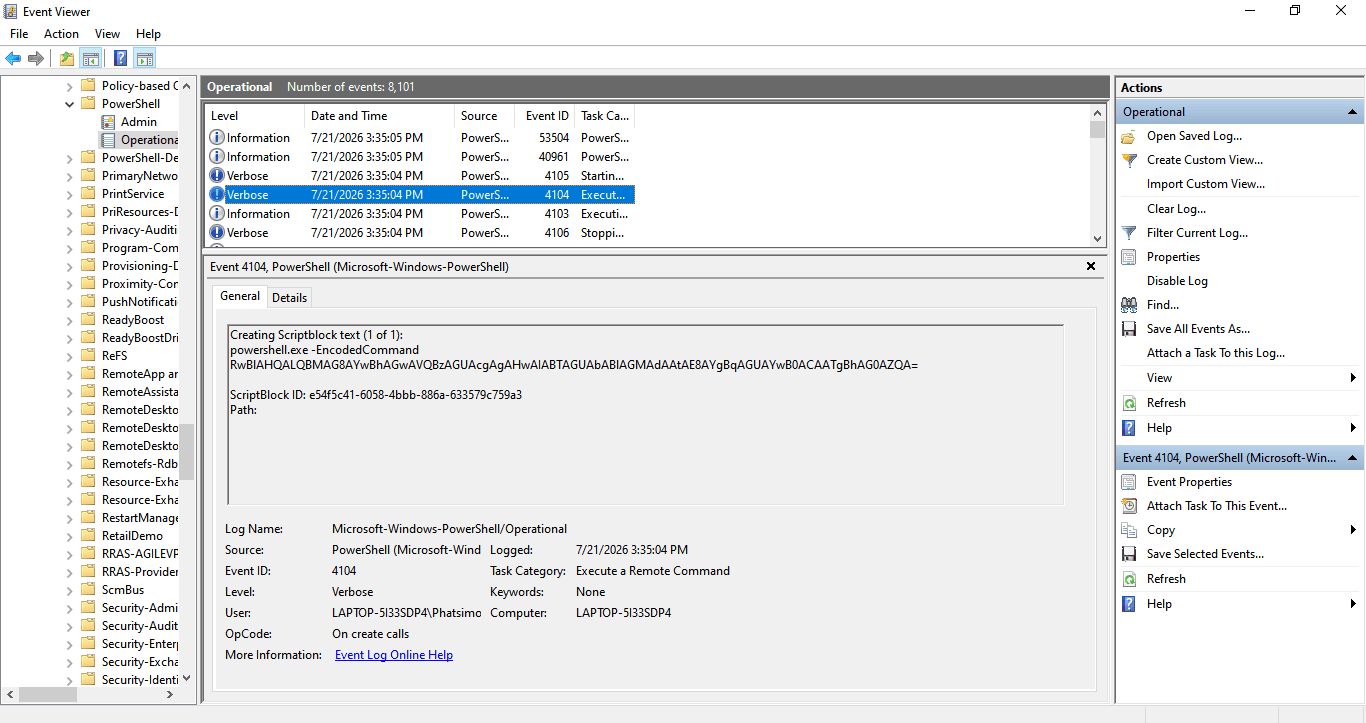 Event Viewer confirmation of the encoded command execution
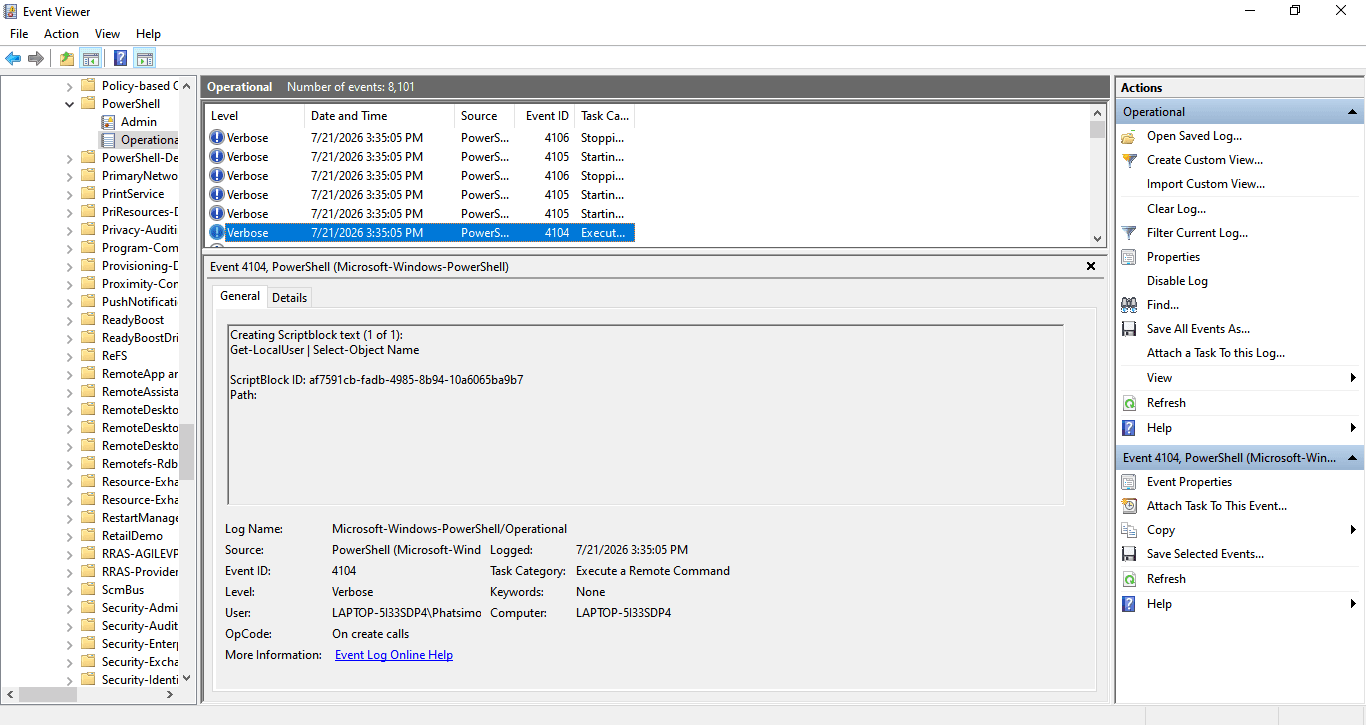 Event Viewer showing the decoded PowerShell command content
Sysmon — Produced two alerts in the Wazuh dashboard:
- Rule 92057 (level 12) — a Process Create event (Event ID 1) correctly identifying a PowerShell process spawning a child PowerShell process executing a base64-encoded command, mapped to T1059.001 under the Execution tactic. The full command line was captured, including the
-EncodedCommandflag and payload — but the payload itself remained encoded in Sysmon's data, since Sysmon logs the literal command line as invoked rather than decoding it. - Rule 92213 (level 15) — a File Create event (Event ID 11) flagged as "executable file dropped in folder commonly used by malware," mapped to T1105 — Ingress Tool Transfer. Investigation of the target filename (
__PSScriptPolicyTest_....ps1) identified this as a benign, known PowerShell internal artifact generated automatically when Script Block Logging evaluates a script — not an actual malicious file drop. This is a genuine false positive produced by Sysmon's default ruleset, triggered purely as a side effect of running an encoded command.
Comparison Summary
Put side by side, the four sources produced four distinct outcomes for the exact same action. The Security log produced no rule-matched event at all — a local, non-network process spawn of this kind falls outside what its default auditing policy captures in this environment. The System log was similarly silent, which is expected, since process execution is outside its scope entirely.
PowerShell Operational sat in the middle: both events existed and were confirmed locally in Event Viewer, but neither surfaced as an alert in the Wazuh dashboard, since neither matched a rule severe enough to be indexed. Where it earned its place was in content — it was the only source that captured the raw command line and the fully decoded script text as separate events, giving a complete picture of both what was typed and what it actually meant.
Sysmon was the only source that produced a dashboard alert, and it produced two: one correct detection capturing the full command line and process ancestry, and one false positive misattributing a benign internal artifact to a Command and Control technique. Sysmon was also the most complete on process-level detail, but its command line data stayed encoded — it recorded that an encoded command ran, without revealing what that command actually did.
The practical implication is that no single source in this lab told the whole story on its own. Sysmon supplied visibility and context that Security and System could not, PowerShell logging supplied the one thing Sysmon couldn't — the decoded payload — and both Security and System, for this particular action, added nothing at all.
MITRE ATT&CK Mapping
The controlled trigger in this lab maps to T1059.001 — PowerShell, under the Execution tactic, correctly identified by Sysmon's rule 92057. This reflects the use of PowerShell as a command and script execution engine — a foundational technique used across a wide range of post-exploitation activity, independent of what the specific command being run actually does.
The false-positive alert (rule 92213) mapped to T1105 — Ingress Tool Transfer under Command and Control, which does not reflect the actual behaviour observed. No tool was transferred into the environment; the flagged file was a transient artifact of PowerShell's own script evaluation process. This mismatch is a useful illustration of a broader principle in detection engineering: a rule mapped to a MITRE technique is only as accurate as the underlying logic that triggers it, and default rulesets can misattribute benign system behaviour to a specific adversary technique when the triggering condition (a file dropped in a temp directory) is not sufficiently specific.
Lessons Learned
- Telemetry presence and alert visibility are not the same thing. Both PowerShell Operational and Security events were confirmed to exist for the controlled trigger, yet neither appeared in the Wazuh dashboard, because default rule severity thresholds gate what reaches the analyst's view. An analyst relying solely on the alerts dashboard would have no visibility into this activity from those two sources.
- Sysmon and PowerShell logging are complementary rather than redundant. Sysmon reveals that an encoded command executed and its process lineage, but the payload itself remains encoded in Sysmon's data. PowerShell Script Block Logging, with invocation logging enabled, generated two separate 4104 events for a single encoded command — one showing the raw invocation and one showing the fully decoded script — making it the only source in this lab that connected the encoded string to what it actually did. Relying on either source alone would leave a meaningful gap.
- Default Sysmon rules can produce confident, high-severity, MITRE-mapped false positives. Rule 92213 fired at level 15 and cited T1105 for a benign PowerShell-generated temp file — a reminder that alert severity and MITRE mapping do not by themselves guarantee accuracy, and that default rulesets require validation against ground truth before being trusted at face value.
- Windows 10 Home's lack of Group Policy support is a manageable constraint, not a blocker. Every setting normally configured via
gpedit.mschas a direct registry equivalent, since Group Policy ultimately writes to the same keys. - Auditing the existing configuration before making changes revealed that System and Application logging were already present by default, narrowing the actual scope of new work required and avoiding redundant configuration effort.
- The
locationfield in Wazuh alerts does not distinguish between Windows event channels — all eventchannel-sourced alerts reportlocation: EventChannel. The channel itself is identified viadata.win.system.channel, which proved essential for any source-specific filtering in this lab and going forward.
Conclusion
This lab extended the Windows telemetry footprint established in Lab 03 beyond the Security log alone, adding PowerShell Module and Script Block Logging and a Sysmon deployment, and forwarding both to Wazuh alongside the pre-existing Security and System sources.
Rather than describing each source's capabilities in the abstract, a single controlled trigger — an encoded PowerShell command — was executed and traced across all four sources. The results showed that visibility varies considerably by source: Security and System stayed silent, PowerShell logging captured both the raw and decoded command content but did not surface as a dashboard alert, and Sysmon alerted twice — once correctly identifying the encoded execution pattern, and once as a false positive tied to a benign internal artifact.
The central finding of this lab is that telemetry existing and telemetry being visible to an analyst are two distinct properties, governed by whether a rule exists to surface a given event at a given severity. This finding, along with the concrete false-positive example produced by Sysmon's default ruleset, sets up the next phase of this series directly: Lab 05 moves into custom detection rule engineering, building on the specific visibility gaps and false-positive patterns identified here rather than treating detection tuning as an abstract exercise.